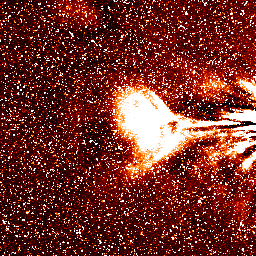
The Level 1 data set is dominated by the F-corona, i.e. the background light due to the scattering of solar photons by dust particles in the interplanetary medium.
")
But on top of this there are signals from, for example, transient solar wind structures (such as CMEs), the suns streamer belts, stars, planets, etc and optical effects in the camera itself. To estimate the "static" background (mainly comprising F-coronal signal), people often take a simple pixel-by-pixel minimum of a set of images. Following discussions with Andy Buffington of UCSD, California (based on his experience with the Coriolis/SMEI heliospheric imager), we have attempted to take a more analytical approach for background subtraction. We take a running window of a fixed number of days (1 and 11 days for hi_1 and 3 and 11 days for hi_2) and, within that window, select the lowest 25% of the data and form an average of that on a pixel-by-pixel basis - this is then subtracted from the current image to make the _brNN data sets where NN is the width of the window in days. Subtracting a background calculated over a shorter period (1 day for hi_1 and 3 days for hi_2) removes more of the the streamer belt contribution to the signal; subtracting a background calculated over a longer period (11 days) retains more of the streamer belt signal. The product that is selected for use should depend on the science one wishes to do.
The following images are scaled with a dynamic range that is 100 times less than that of the F-corona image above. The first image (1 day background) effectively excludes the streamer belt in hi_1, the second (11 day background) shows the streamer belt.

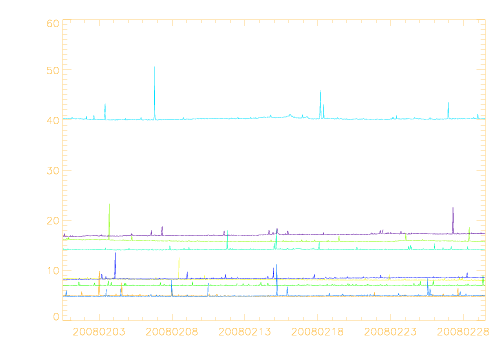
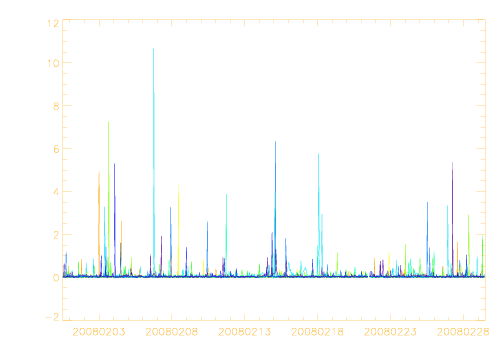
Another way of looking at this subtraction process is to look at the time sequence of the signal in a single pixel; as an example the following plots show time sequences vs signal intensity in DN/Sec/Pixel from 9 pixels spaced in a regular grid across the hi-1 field of view. The first panel is before subtraction and demonstrates a different base level for each pixel whereas the second panel, from the 1 day background subtracted data, shows all 9 pixels with essentially a common base level of 0. Most of the spikes in the graphs are due to stars passing through the field of view.
Periodically the HI_1B camera undergoes jumps in pointing direction - thought to be due to dust impacts on the instrument since it is mounted facing the ram direction of the spacecraft. Since earlier processing of the data allows us to compute the current pointing of the camera by fitting the observation to the known starfield we can measure this change and if the offset in the image sequence is more that one pixel then we interpolate the images in the window to allow us to compute the "static" element above before subtracting from the current image.